Main GUI
The main GUI of EXtra-foam is divided into several control panels grouped by functionality and a log window.

Action bar
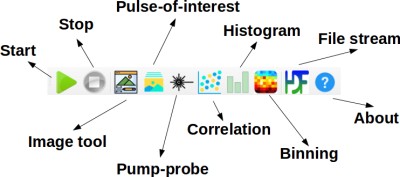
Start
Start acquiring, processing and visualizing data.
Stop
Stop acquiring and processing data.
Image tool
Open the Image tool for image related manipulation and analysis.
Pulse-of-interest
Open the window for monitoring up to two pulses of interest. Only available for pulse-resolved detectors
Pump-probe
Open the window for Pump-probe analysis.
Correlation
Open the window for Correlation analysis.
Histogram
Open the window for Histogram analysis.
Binning
Open the window for Binning analysis.
File stream
Open the window for Stream data from files.
About
Data source
Bridge client connections
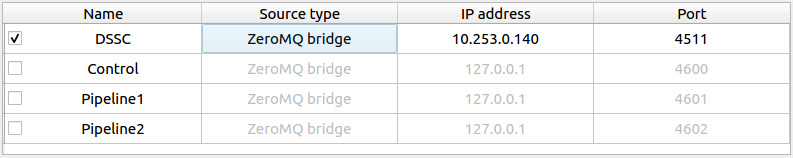
Bridge settings in EXtra-foam.
EXtra-foam supports different kinds of data flows. Unless you are very familiar with the EXtra-foam and Karabo, it is recommended to use the scenario 1 depicted in Streaming from Karabo. Namely, only one connection should be checked.
| Input | Description |
|---|---|
Source type |
Receiving the data from
|
IP address |
IP address of the TCP connection. |
Port |
Port number of the TCP connection. |
Data source tree
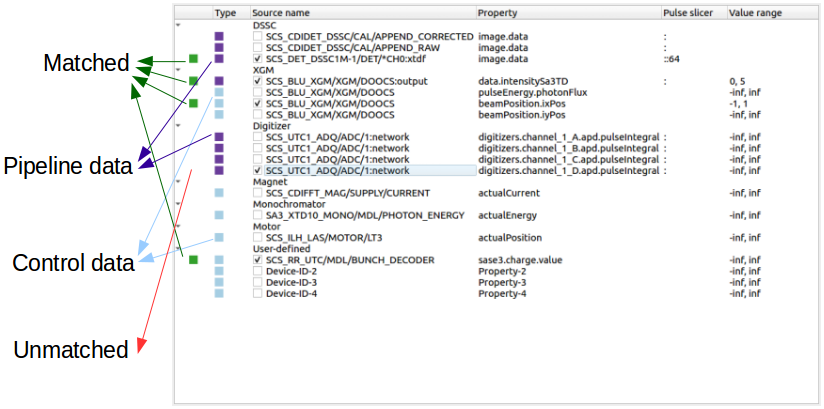
In the data source tree, one can select which data source items (the ID of a data source item is defined by both the Source name and the Property) are required in the analysis. Data source items can be configured via Config file. Users are not allowed to add/delete data source items in the GUI, i.e. add or delete rows in the tree. Alternatively, users can modify an existing data source item when it is checked.
When a data source item is checked and is matched (found together with other data source items with the same train ID), the indicator on the first column of the tree will turn green. The indicator will turn red if the data source item is not able to be matched for a while or it is unchecked.
| Input | Description |
|---|---|
Type |
Pipeline data or control data. |
Source name |
Karabo device or output channel name |
Property |
Property of the given device or output channel |
Pulse slicer |
The input will be used to construct a slice object in Python which is used to select the specified pulse pattern in a train from a pipeline data. |
Value range |
Value range filter of the corresponding source. When it applies to a pipeline data, it will apply data filtering pulse-by-pulse. When it applies to a control data, it will then apply data filtering train-by-train. Not all pipeline data support it |
Source monitor
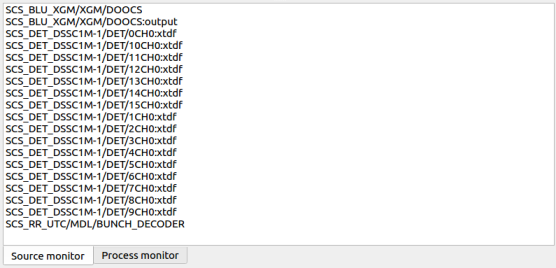
Source monitor is used to display sources names (Karabo device and output channel) received by the Karabo bridge client. Different from the (match/unmatched) indicator in the data source tree, it also shows sources which do not exist in the data source tree. When a modular source (e.g. DSSC data) is selected and matched, it displays individual names of the received modules. However, the source monitor does not show property names for speed, as a Karabo device can have dozens of control data. The property names of a Karabo device or an output channel can be found in the Karabo GUI when you are performing online analysis in the hutch, or in the File streamer when you are streaming data from files.
Note
The Karabo bridge client will only start to receive data when the green Start bridge button is checked and the data source item of the main detector is selected.
General analysis
Global setup
Define analysis parameters used globally.
| Input | Description |
|---|---|
POI indices |
Indices of the pulse of interest (POI) 1 and 2. It is used for visualizing a single image in the Pulse-of-interest window. If ‘Pulse slicer’ is used to slice a portion of the pulses in the train, this index is indeed the index of the pulse in the sliced train. Pulse-resolved detector only. |
Moving average window |
Moving average window size. If the moving average window size is larger than 1, moving average will be applied to all the registered analysis types. If a new window size is smaller than the old one, the moving average calculation will start from the scratch. Currently, this setup will affect the calculations of:
|
Reset |
Reset the moving average counts of all registered analysis types. |
Warning
Since version 1.10, another moving average was re-activated in Image tool. If both the moving averages are set, the result of azimuthal integration, ROI FOM and ROI 1D projection will be a moving average on top of the moving averaged image! This is due to some historical reason and it will be fixed in the future.
Pump-probe setup
Pulse filter setup
Apply data reduction by setting the lower and upper boundary of the specified FOM. Currently, it affects calculating the average of images in a train as well as the averages of images of ON-/Off- pulses in a train
| Input | Description |
|---|---|
Analysis type |
See Analysis type. |
FOM range |
Number of bins of the histogram. |
pulse resolved |
This checkbox is only enabled for the pulse-resolved detectors. When it is checked, the filtering is pulse-wise. Otherwise, the filtering is train-wise. |
Analysis setup manager
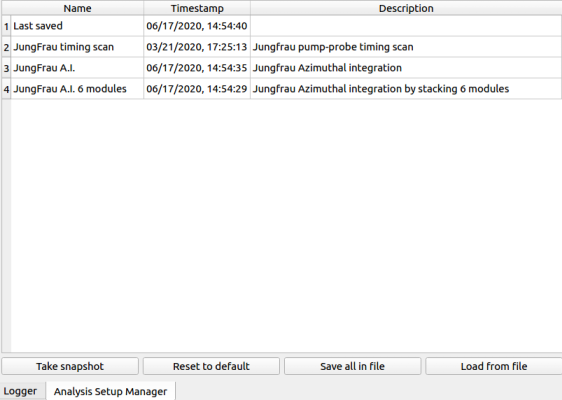
Analysis setup manager is a new feature introduced in version 0.8.1, it allows users to save and load
different analysis setups (a snapshot in the Redis database) conveniently. To apply a setup,
simply double-click the name of the setup listed in the table. Please distinguish it
from Config file, which is mainly used for data source management. Due to the historical
reason, some setups in the Config file can also be saved and loaded via the Analysis setup manager,
like photon energy, sample distance, etc. Config file defines the default setups
which will be overwritten when a setup in the Analysis setup manager is applied. The default setups
can be recovered by clicking the Reset to default button.
| Input | Description |
|---|---|
Take snapshot |
Take a snapshot of the current parameters and store them in
Last saved. |
Reset to default |
Reset the current parameters to default. Last saved will not
be affected. |
Save all to file |
Save all the setups listed in the table to file. The data in the setup file will be overwritten. |
Load from file |
Load setups from file. In case of name conflict, the listed setups in the table will be overwritten. |
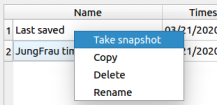
When right-clicking the name of a snapshot, a context menu will show up:
| Input | Description |
|---|---|
Take snapshot |
Take a snapshot of the parameters and store them in both the
Last saved and the selected analysis setups. |
Copy |
Make a copy of the selected analysis setup. |
Delete |
Delete the selected analysis setup. |
Rename |
Rename the selected analysis setup. |
Warning
Analysis setup manager is still in the testing phase and we are collecting feedbacks from users. It should be noted that there is no backup recovery mechanism for now.
Extensions
On the left hand side there is a tab bar, one for the main GUI and the second for the extensions settings:
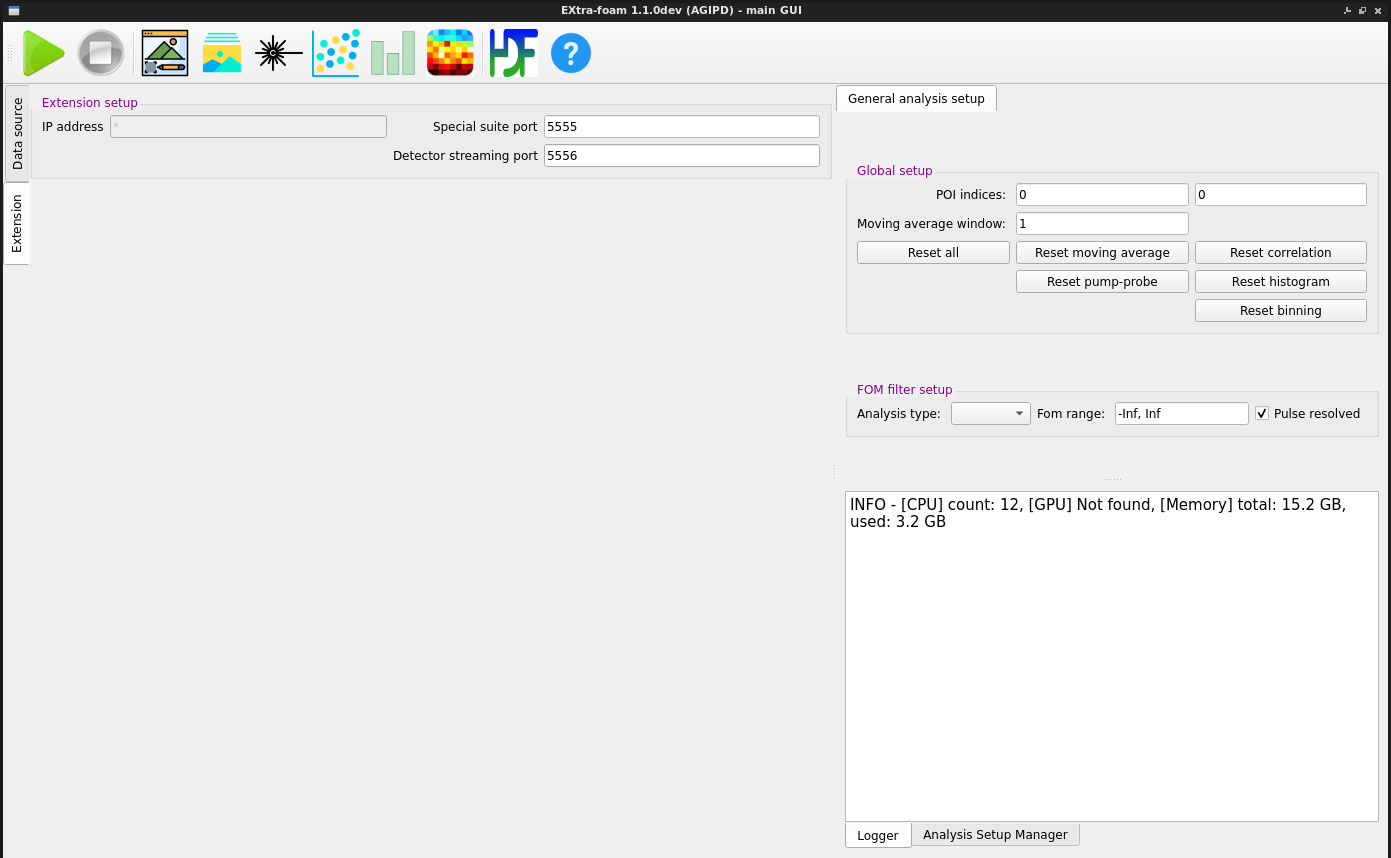
EXtra-foam supports streaming the processed data in two ways:
- All processed data may be streamed to a Special analysis suites.
- Just the processed and averaged detector image may be streamed over a Karabo
bridge. This is could be helpful if, for example, an experiment requires using
two detectors simultaneously. In this case EXtra-foam could be set up to read
data from both a trainmatcher/Karabo bridge hosted in Karabo and another
EXtra-foam instance. To get the detector data from a Karabo bridge client,
use the key
EF_<source_name>, wheresource_nameis the source name of the main detector. For example, if streaming ePix data from the deviceMID_EXP_EPIX-2/DET/RECEIVER:outputwith propertydata.image, useEF_MID_EXP_EPIX-2/DET/RECEIVER:outputanddata.imageat the client.
Warning
There are limited use-cases for streaming detector data to another EXtra-foam instance, contact da-support@xfel.eu if you would like to do this.
| Input | Description |
|---|---|
Special suite port |
Port to use for streaming data for the special suites. |
Detector streaming port |
Port to use for streaming the processed 2D detector image. |