Special analysis suites
Introduction
Special analysis suite is a new concept introduced in the version 0.8.2 to solve some issues which cannot be addressed in EXtra-foam core. Each suite is a group of applications (we will call it app in the rest part of this documentation) dedicated for specific online analysis. The following table compares EXtra-foam core and special suite in various aspects.
| EXtra-foam core | EXtra-foam special suite |
|---|---|
| General purpose; rich features. | Special-purposed small apps. |
| Heavy computation. | Light computation. |
| Image detector oriented. | Any detector. |
| One instance per detector per cluster. | No restriction on number of instances. |
| GUI performance degrades with a lot of plots. | Limited plots per app. GUI update rate can reach 10 Hz in most cases. |
| Complicated. | Easy to implement. |
| Multi-process; distributed. | Single-process; multi-threading. |
| Python and C++. | Pure Python. |
| Depends on EXtra-foam core; may need a core instance to run. |
There are two different work flows for special analysis:
- The special analysis receives processed data from a main EXtra-foam instance;
- The special analysis is independent from the main instance and it directly receives data from a “Karabo bridge”.
The first work flow can be deemed as an extension to EXtra-foam core, while the second one is indeed similar to a mini karaboFAI prior to version 0.4.7.
The special analysis suite can be started by typing
extra-foam-special-suite TOPIC
in a terminal. Depending on the topic, you will see a facade window like
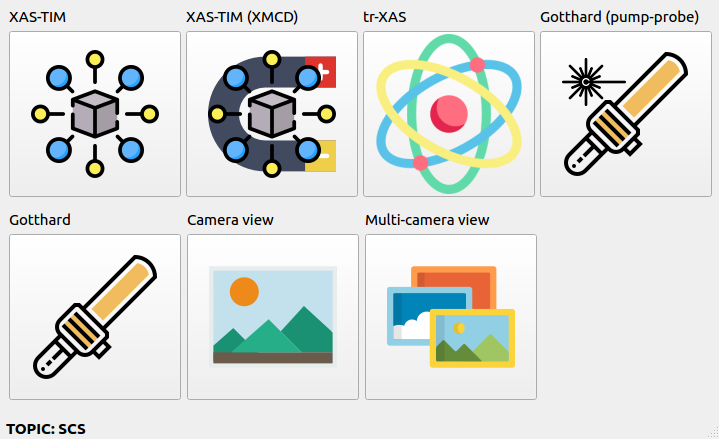
Click one of the app icons and the analysis window will show up and the facade will be closed. If one needs two instances of the same app, one can simply repeat the process. Apps in special suite can be further categorized into special-purposed (e.g. XAS-TIM, tr-XAS) and general purposed (e.g. Camera view, multi-camera view) apps. General purposed apps will appear in any topic while special-purposed apps will only appear in certain topics. Moreover, the same special-purposed app may behave differently in different topics. Namely, they are really customized for topics.
More info on command line arguments can be obtained as
[user@exflonc12 ~]$ extra-foam-special-suite --help

 usage: extra-foam-special-suite [-h] [-V] [--use-gate] [--debug]
                                 {SPB,FXE,SCS,SQS,MID,HED,DET}

 positional arguments:
   {SPB,FXE,SCS,SQS,MID,HED,DET}
                         Name of the topic

 optional arguments:
   -h, --help            show this help message and exit
   -V, --version         show program's version number and exit
   --debug               Run in debug mode
General purposed apps
Camera view, Vector view, multi-camera view
Camera view

Camera view is a light-weight image tool for monitoring image data updated at 10 Hz or even faster. It also allows to monitor (ROI) histogram of the image. When the ROI is activated, histogram is calculated over the ROI instead of the whole image. It supports any train-resolved image data, i.e. an image data which has a shape of (y, x) or (1, y, x) or (y, x, 1).
More small features will be added in the future.
| Input | Description |
|---|---|
Output channel |
Output channel name. |
Property |
Image data property name. |
M.A. window |
Slicer used to slice pulses in a train. |
Bin range |
Histogram bin range. |
# of bins |
Number of histogram bins. |
Vector view

Vector view helps you monitor 1D data like XGM intensity, digitizer pulse integral, pulse-resolved ROI FOM and the correlation between them. Vector view receives processed data from a main EXtra-foam instance.
| Input | Description |
|---|---|
Vector1 |
Vector 1. |
Vector2 |
Vector 2 (optional). |
Note
In order to correlate two vectors, you will need to use the Pulse slicer in the data source tree located in the main GUI to select the data.
Warning
To have the pulse-resolved ROI FOM data, currently you must open the Histogram window in the main GUI and select ROI FOM as the analysis type. This will activate the pulse-resolved ROI FOM calculation, which is a little bit expensive. Also, make sure the Pulse resolved checkbox is checked.
Special purposed apps
- SPB
Gotthard
- FXE
Bragg diffraction peak, XES
- SCS
Gotthard, Gotthard (pump-probe), tr-XAS, XAS-TIM, XAS-TIM-XMCD
- MID
Gotthard, Gotthard (pump-probe)
- HED
- DET
Multi-module scan
- XPD
Gotthard
Gotthard

When the ROI is activated, histogram is calculated over the ROI instead of the whole image.
For applying dark subtraction, one can record the dark online or load a dark run from the file.
| Input | Description |
|---|---|
Output channel |
Output channel name. |
M.A. window |
Moving average window size. |
Pulse slicer |
Slicer used to slice pulses in a train. |
P.O.I. (sliced) |
Index of the pulse of interest after pulse slicing. For example, if there are 60 pulses in a train and the slicer only selects a half of them. The index range will be from 0 to 29. |
Bin range |
Histogram bin range. |
# of bins |
Number of histogram bins. |
Scale (eV/pixel) |
Scale used for axis calibration. If it is zero, no calibration
will be performed and the Offset will be ignored as well. |
Offset (eV) |
Offset used for x-axis calibration. |
Histogram over M.A. |
Check to calculate the histogram over the moving averaged data. |
Gotthard (pump-probe)

| Input | Description |
|---|---|
Output channel |
Output channel name. |
M.A. window |
Moving average window size. |
On-pulse slicer |
Slicer used to slice on (pumped) pulses in a train. |
Off-pulse slicer |
Slicer used to slice off (unpumped) pulses in a train. The numbers of the on and off pulses must be the same. |
Pump-probe P.O.I. |
Index of the pump-probe pulse of interest. For example, if there are 10 on-pulses and 10 off-pulses, the range of the index is from 0 to 9. |
Dark-pulse slicer |
Slicer used to slice dark pulses in a train. |
Dark-pulse P.O.I. |
Index of the dark pulse of interest. For example, if there are 5 dark pulses and the total number pulses is 100, the index range is from 0 to 4 regardless of the dark pulse positions in the train. |
tr-XAS

XAS-TIM

| Input | Description |
|---|---|
XGM Output channel |
XGM output channel name. |
Digitizer output channel |
Digitizer output channel name. |
Digitizer channels |
Check to analyze data on the corresponding channel. |
Mono device ID |
Monochromator device ID. |
# of pulses/train |
Number of ‘useful’ XGM pulses in a train. |
APD stride |
Stride used in slice the digitizer APD data. |
XGM intensity threshold |
Pulses with XGM intensity below this threshold will be ignored. |
Pulse window |
Maximum number of pulses used in calculating the spectra. |
# of energy bins |
Number of energy bins for spectra calculation. |
Pulse window |
Maximum number of pulses used in I0/I1 correlation visualization. |
Show spectra |
Check to show spectra on the corresponding digitizer channel. |
XAS-TIM-XMCD

XAS-TIM-XMCD is very similar to XAS-TIM. For input not listed in the following table, please refer to the input table in XAS-TIM.
| Input | Description |
|---|---|
Magnet device ID |
Output channel name of the device which provides the magnet current values. |
Magnet current threshold |
Pulses with an absolute magnet current value below this threshold will be ignored. |